KA

Hi, I am

Kaan Altay

FROM STATISTICS TO DATA SCIENCE

From financial audit to production ML — turning data into business decisions

Data scientist with a background in financial auditing at PwC, now building production-grade ML systems and forecasting solutions in e-commerce. I work with statistical modeling, Python, AWS, and deep learning.

Production ML Forecasting AWS & MLOps Financial Analytics

About Me

I'm a Statistics graduate who took an unconventional path — from analysing financial data as an auditor at PwC to building end-to-end machine learning systems in e-commerce. That journey gave me something most data scientists don't have: a deep understanding of both the business side and the technical side of data.

At ImeBrands, I worked on real production systems — time series forecasting, NLP, Computer Vision, recommendation engines, and RAG-based AI assistants — deployed on AWS and built to solve actual business problems, not just score well on a benchmark.

Name

Kaan Altay

Email

kaan_altay@outlook.com.tr

Role

Data Scientist

Location

İstanbul, Turkey

Kaan Altay

My Story

The Road That Led Here

My journey didn't follow a straight line — and I think that's what makes it interesting. It started in the Statistics department at Eskişehir Technical University, where I realised data wasn't just numbers — it was a language. Every dataset had a story, and I wanted to be the one who could read it.

After graduating, I joined PwC as an auditor. Working with large-scale financial data taught me something no course could: how businesses actually think, how decisions get made, and how much is at stake when numbers are wrong. Then life intervened — I stepped away for health reasons, and used that time to make a deliberate decision: I was going to pivot into data science. Not drifting — deciding.

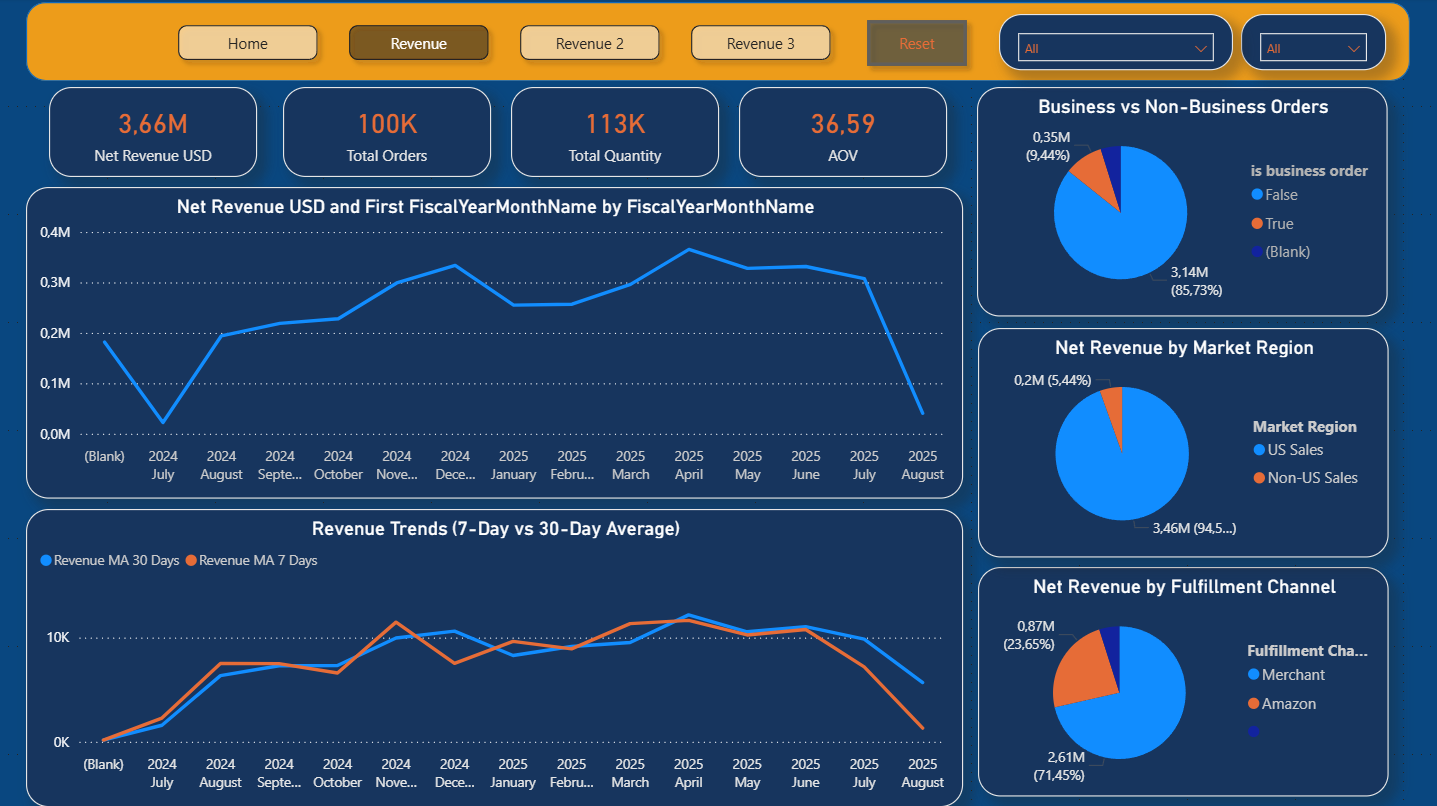
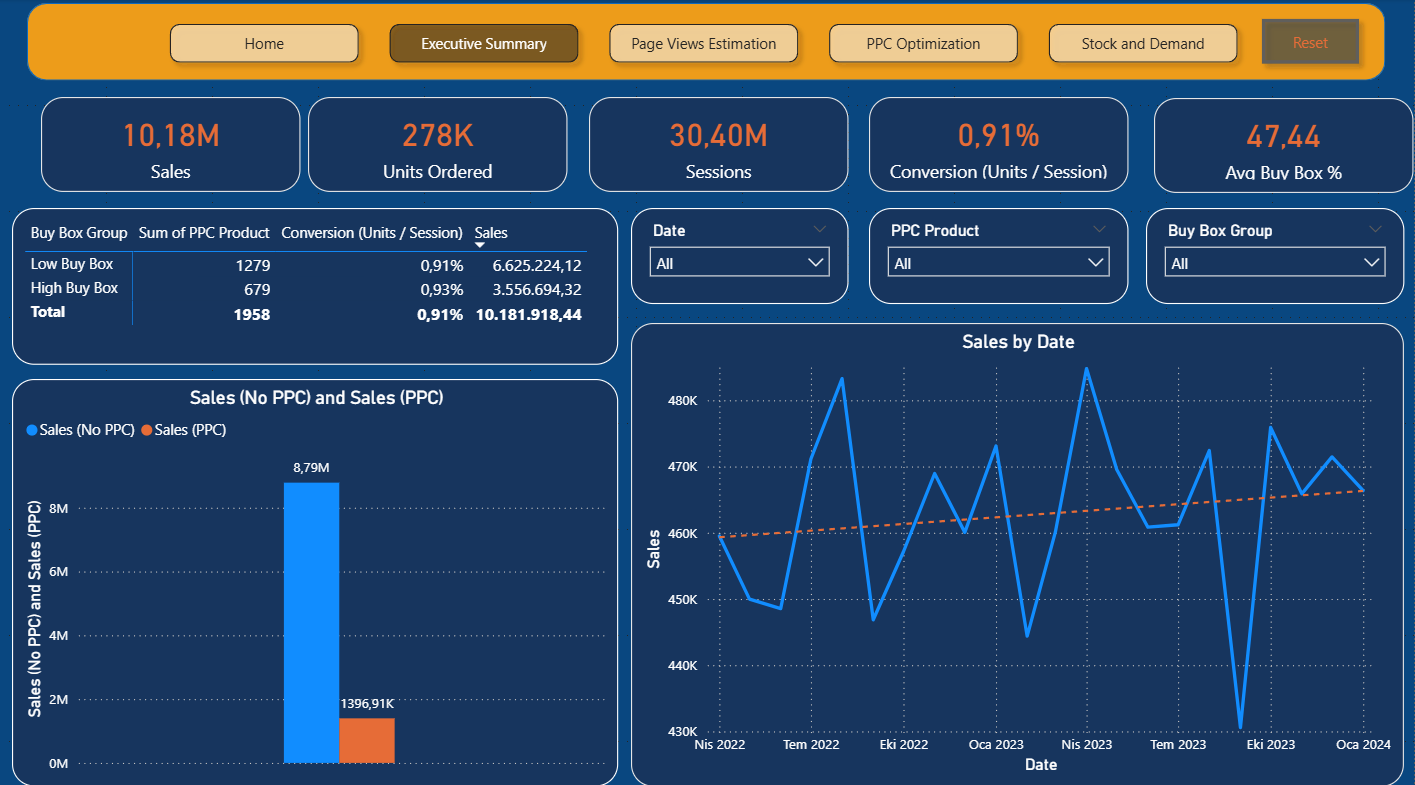
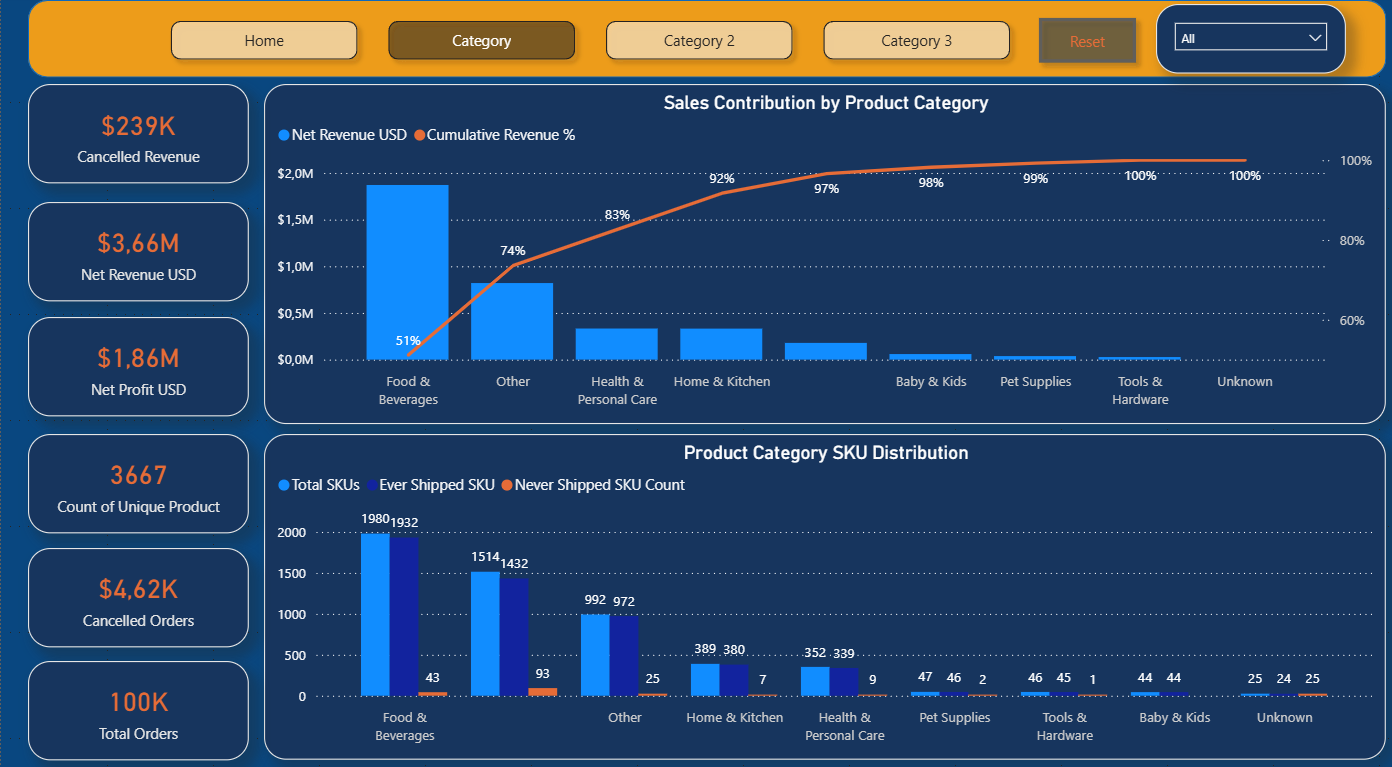
That's how I ended up at ImeBrands, building production ML systems on AWS, solving real e-commerce problems with machine learning. And that's where I realised this is exactly where I'm supposed to be.

Education & Experience

B.Sc. Statistics

Eskişehir Technical University

2016 - 2022

Assurance Associate

PwC Turkey

Sep 2022 – Jul 2023

Data Scientist

ImeBrands · Remote, USA

Jan 2025 – Feb 2026

Experience

Practical experience and project highlights from my professional journey.

Assurance Associate

PwC Turkey

PwC Turkey · Sep 2022 – Jul 2023 Audited large‑scale financial datasets — trial balances, sub‑ledgers, and year‑end reports — for manufacturing and service clients under IFRS standards. Performed data validation, reconciliation checks, and variance analysis where accuracy wasn't optional. Working at one of the Big Four taught me that data quality is never just a technical problem; it's a business risk. That mindset now sits at the core of every ML system I build.

Data Scientist & Analyst

IMEBRANDS

ImeBrands · Remote, USA · Jan 2025 – Feb 2026 Wore two hats at once — building production ML systems on AWS while also owning the data analysis side of the business. On the ML front: time series forecasting, NLP pipelines, Computer Vision models, recommendation engines, and a RAG‑based AI assistant. On the analysis side: turning messy e‑commerce data into clear, decision‑ready insights for the business team.

My Projects

A selection of projects that demonstrate my skills in machine learning, deep learning, NLP, and statistical modelling.

ML Projects

Project Image

Computer Vision

Manual product categorization is one of the biggest bottlenecks in e-commerce operations. This Computer Vision system automates it — using MobileNetV2 transfer learning to classify Amazon product images across 9 categories, achieving 82% validation accuracy with top categories exceeding 90%. Trained on a frozen ImageNet backbone with custom top layers, data augmentation, and EarlyStopping. Supports both single-image and batch prediction modes with confidence thresholding to flag uncertain classifications.

Python TensorFlow MobileNetV2 Transfer Learning Computer Vision Streamlit
Project Image

RAG Chatbot

A hybrid AI assistant for Amazon seller analytics, built on a real-world e-commerce architecture with synthetic data. Routes each question automatically — SQL for structured queries, semantic search for open-ended ones — across 6 integrated data sources covering revenue, advertising, buy box performance, and product metrics. No SQL knowledge required; just ask in plain English and get back transparent, query-backed answers.

Python LangChain RAG SQL Streamlit HuggingFace FAISS
Project Image

Sentiment Analysis

For e-commerce brands, one wave of negative reviews can tank a product ranking overnight. This system runs 4 models in parallel on Amazon product reviews to go beyond basic sentiment — BERT classifies the tone, a second model identifies the root cause (shipping, price, quality), KeyBERT extracts the exact phrases driving dissatisfaction, and PyABSA pinpoints which product aspects triggered the complaint. The result: actionable intelligence, not just a sentiment score.

Python BERT HuggingFace KeyBERT PyABSA NLP Streamlit
Project Image

Recommendation System

In e-commerce, knowing what customers buy together is as valuable as knowing what they buy at all. This system mines Amazon order data using the Apriori algorithm to surface cross-sell opportunities — discovering product pairs with high lift, confidence, and support scores. Outputs feed directly into bundle creation, post-purchase email campaigns, and ad targeting strategies.

Python Apriori mlxtend Association Rules Streamlit Pandas
Project Image

Income Prediction

Getting revenue forecasts wrong by even one quarter can derail an entire business strategy. This system approaches the problem with 4 models — SARIMA for seasonal patterns, Prophet for holiday effects, XGBoost with 78 engineered lag and rolling features, and LSTM for long-term dependencies — combining them into an ensemble that generates weekly revenue and profit forecasts up to 13 weeks ahead. Built for quarterly planning: know what's coming before it arrives.

Python SARIMA Prophet XGBoost LSTM Time Series Streamlit
Project Image

Buybox Prediction

Buy Box ownership is one of the biggest revenue drivers in e-commerce — and this system predicts it. An ensemble of 6 models (Ridge, Random Forest, Gradient Boosting, XGBoost, LightGBM) trained on 78 engineered features generates per-ASIN forecasts with confidence intervals and automatic risk flags. The standout finding: advertising presence alone accounts for 81% of feature importance — a result that directly shaped ad spend strategy.

Python XGBoost LightGBM Scikit-learn Streamlit Feature Engineering

Data Analysis Projects

Project Image

Olist E-Commerce Analytics Dashboard

Customer satisfaction in e-commerce often comes down to one thing: did the order arrive on time? This dashboard explores that question — and many others — across 100,000+ orders from the Brazilian Olist marketplace. Five analytical layers cover revenue trends, delivery performance and its measurable impact on review scores, product category concentration, cross-state logistics patterns, and repeat purchase behaviour. The standout finding: delayed deliveries consistently scored lower on reviews, making logistics the single biggest lever for customer satisfaction.

Python Pandas Plotly Streamlit EDA Customer Segmentation
Project Image

Stroke Risk Analytics Dashboard

Stroke is largely preventable — if the right risk signals are caught early. This dashboard analyses 5,000+ patient records across clinical and demographic dimensions to surface the patterns that matter most: stroke rate by age group, the compounding effect of hypertension and heart disease, glucose and BMI thresholds, and smoking behaviour. Built around an interactive five-factor risk scoring system, it transforms raw patient data into a prevention-focused decision support tool. Key finding: age emerged as the strongest single predictor, with stroke rates rising sharply beyond 60.

Python Pandas Plotly Streamlit Healthcare Analytics EDA Risk Analysis
Project Image

Amazon Revenue & Profitability Analysis

Revenue alone never tells the full story of an e-commerce business. This Power BI dashboard — built on a real-world Amazon seller architecture and demonstrated with synthetic data — goes four layers deep: revenue trends, profitability margins, cancellation patterns, and churn behaviour. Each layer answers a different business question: where is money coming in, where is it leaking out, which orders are being lost before fulfilment, and which customers are quietly walking away.

Power BI DAX Revenue Analysis Churn Analysis E-Commerce
Project Image

Amazon Sales Analytics

Selling on Amazon means managing four moving parts at once: traffic, advertising, inventory, and sales performance — and a blind spot in any one of them costs money. This Power BI dashboard covers all four: executive-level sales health, page view estimation for traffic insights, PPC optimization to cut wasted ad spend, and stock-demand analysis to stay ahead of both stockouts and overstock. Built on a real-world seller architecture, demonstrated with synthetic data.

Power BI DAX PPC Analysis Inventory Management E-Commerce
Project Image

Amazon Marketplace Analytics

Most Amazon dashboards stop at revenue. This one goes further — covering category performance, product-level analysis, Buy Box dynamics, and private label strategy to benchmark own-brand performance against marketplace competition, then pushing into statistical territory with A/B testing and effect size analysis. That last layer is what sets it apart: not just "what happened" but "did it actually matter, and by how much?" Built on a real-world seller architecture, demonstrated with synthetic data.

Power BI DAX A/B Testing Effect Size Buy Box Market Analysis
More on GitHub LinkedIn Profile 🤗 Hugging Face Profile Streamlit App

My Skills

Tools & Expertise

🧠
ML / AI
Machine Learning Deep Learning Scikit-learn XGBoost LSTM CNN Transfer Learning NLP Computer Vision HuggingFace LangChain RAG
💻
Programming & Data
Python SQL Pandas NumPy
🛠️
Frameworks & Tools
PyTorch TensorFlow Keras Streamlit AWS Git GitHub
📊
Visualization & BI
Power BI Data Visualization
🎯
Domain Expertise
Statistical Modelling Regression Analysis Hypothesis Testing Clustering Recommendation Systems Anomaly Detection Feature Engineering A/B Testing Time Series

Contact

Have a question or want to collaborate? I'd love to hear from you!

Contact Information

Location

İstanbul, Turkey

Email

kaan_altay@outlook.com.tr

Availability

Monday – Friday, 9:00 – 18:00

Follow Me